Why Averages Often Mislead Stakeholders (And What to Use Instead)
When creating reports for stakeholders, averages may give misleading summary information. Be sure to include additional summary metrics to give an accurate depiction of the data.
- Averages alone may not give an accurate depiction of data sets
- Medians should be used in addition to Averages
- Include MIN and MAX functions to show full range of data
Who benefits from this article? Salesforce Functional Talent: Administrators, Architects and Consultants
What can you expect as an outcome? This article will give a simple yet effective way to create better reporting metrics for your employer and clients.
Elementary Math, Executive Problems
One of the easiest ways to accidentally mislead people in Salesforce is by using the wrong summary metric.
The biggest offender?
The average.
Most of us learned how to calculate averages back in elementary school – add up the numbers and divide by the count. We also learned about medians – the middle value when numbers are sorted smallest to largest.
Then we promptly forgot about them and resorted to only using averages for the rest of our lives.
I understand that math is not fun for most of us and I have a sneaking suspicion you may be feeling a bit of PTSD flaring up as you are reading this.
But if you’re building reports or dashboards in Salesforce, understanding the difference between these two numbers is critical.
Because averages can easily lie to you.
In fact, not understanding the difference between these two mathematical methods can lead to chaos, confusion, and frustration for end users, management, and executive leadership teams.
Unless you took advanced statistics classes in high school or college, you may not fully grasp the risk of relying on averages alone for measurements of central tendency. Central Tendency is just a fancy math term meaning, “what should I expect?”
You see, averages are very finicky and are easily skewed by very large or very small numbers. Averages shouldn’t be trusted unless you are confident the data set is a normal distribution. Don’t worry – you don’t need to understand what is meant by “normal distribution.”
A Real-World Illustration
Let’s say a sales manager asks you for a report. She’s trying to increase the average deal size of each opportunity that is won and wants to set goals for her team around this metric. She needs to know what the “average” deal size was for opportunities won last year.
Easy request, right?
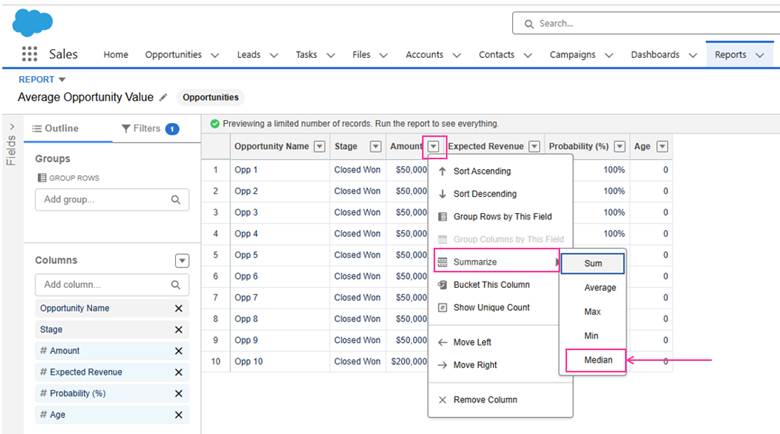
All you need to do is create an Opportunity report with filters for Won = True and Close Date = Last Year. Then on the Amount field click the drop down arrow, hover over Summarize, then select Average.
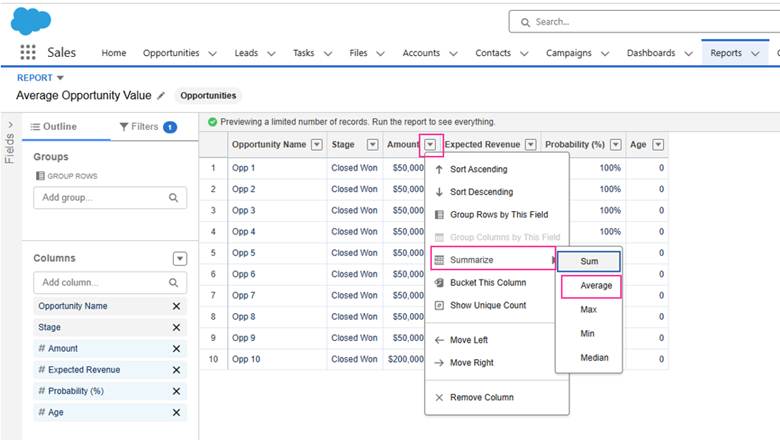
Voila! Salesforce automatically gives you the average size of Won Opportunities last year.
Piece of cake! Your job is done!
What you didn’t realize, though, is that the size of the deals isn’t normally distributed (AKA – it’s scattered all over the place). This means that the “average” is lying to you because it’s being heavily influenced by a very small percentage of deals that were either extremely large in value or extremely small in value.

An Easy Example
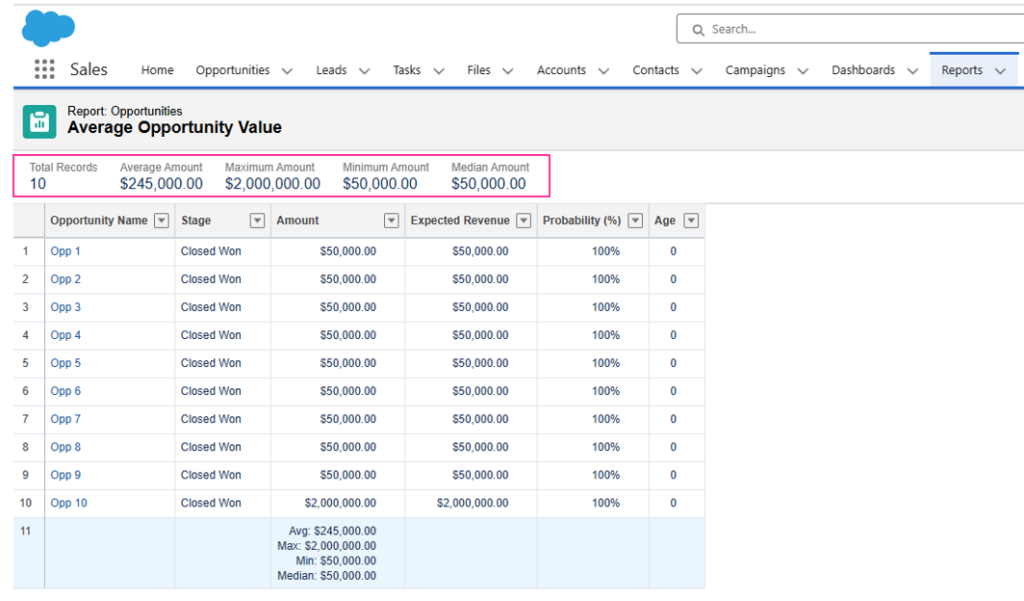
Say you had 10 sales last year. Nine of those sales were for $50,000. But, one of those sales was for a whopping $2,000,000!
If you only look at the average of the sales (you add $50,000 nine times and add $2,000,000 then divide the sum by 10), you would be told that you should expect each sale to be around $245,000. And if your sales manager uses this number as the quota for what she expects each opportunity to be valued at, you may have a revolt on your hands.
As of Summer 2022, Salesforce has blessed us with the ability to include medians as part of the summarization function in reports (finally….after 14 years of asking on Idea Exchange!). You can find it under the Average option in that exact same Summarize menu.
In our example above, using the median would return a result of $50,000 rather than the $245,000 average. In this case, the median gives us a much more accurate representation of what each sales rep is capable of selling on each opportunity.
Understanding how these two functions operate is critical for anyone providing data to stakeholders.
Because of the quirks of averages, I always include Average and Median values in any report or dashboard component so stakeholders can clearly see large differences between the two numbers. Additionally, I often include MIN and MAX because this will help stakeholders understand the full range of data.
When it comes to reporting, the goal isn’t just to produce numbers – it’s to ensure you are presenting an accurate depiction of the data.
Interested in this Topic?
Learn more about reporting on Trialhead and be sure to check out my book where I dive much deeper into Salesforce reporting quirks, and many other laugh-until-you-cry topics:
Why, Salesforce? WHY?
A Battle-Hardened B/Admin-eloper’s Guide to Life Off the Trail
It can be found on Amazon in hardback, paperback, or eBook
Connect with Kimberlee, the author, on LinkedIn – DM her if you’d like a digital copy of Chapter 45: The Long Night of the Misleading Average (Or: A Guide to Lying with Statistics)

Want Even More Salesforce Career Content?
Watch Salesforce Career focused videos, listen to podcasts and check the menu items above for links to free content and courses.